Q&A: Stephen Willcock talks Apex Log Analyzer and making developers lives easier
Certinia Chief Architect, Stephen Willcock, and his team recently built and introduced the Apex Log Analyzer, a tool designed to help developers understand logs faster and quickly find code issues. While initially built for internal use, it was released last month in partnership with Salesforce and you can install the extension from the Visual Studio Code Marketplace.
We chatted with Stephen about this long-sought-after developer tool: why they built it, how it works, and what it’s bringing to the Salesforce development community.
UPDATE: As of March 15, 2021, there have been nearly 23,000 downloads of the Apex Log Analyzer. You get your own and learn more here.
What is a “log”, and why would I need to analyze it?
The Salesforce platform generates server “logs” – technical reports about code – which provide a mine of information useful to developers about how their code gets executed on the platform. We need to analyze these logs so we can accurately anticipate how our code will run, and with what effects and side-effects.
What made you decide to build the Apex Log Analyzer?

While these Salesforce logs are rich with information, they are also very difficult for developers to derive actionable insights and diagnose an issue simply by reading them. We really wanted a tool that can aggregate results from a log to show measures like “how many times”, “how long”, or “how long in total” for specific operations.
Lucky for us, Certinia engineers have been known to write their own tools that make processes like these easier. Thus, the prototype for the Apex Log Analyzer was born.
And when Salesforce embraced Microsoft Visual Studio Code, it seemed like a great idea to take our existing tool and rebuild it for Visual Studio Code. I think Salesforce had been hunting around for a tool like this for a while and when they first saw it, they were eager to collaborate and bring this to the Salesforce developer community.
What can you do now that you couldn’t do before?
Parse logs easier, find problems much faster, and improve the performance and quality of code executing on the Salesforce platform.
How does the tool work?
The Apex Log Analyzer extracts useful information from logs then adds structure to the information– graphically representing performance of processes. This can be hugely beneficial: speeding up development, tuning performance, and troubleshooting issues.
The tool provides a number of views including:
- Analysis: This tab gives you a summary of method performance, showing you total duration, net duration and number of times each is called. The methods taking the longest and being called the most can be a good place to look for potential optimizations. You can sort the list by any of the fields to let you focus on what you are most interested in.
- Database: This tab gives you a breakdown of the DML and SOQL queries contained in the log. For each, you can see the number of times a statement is executed and the number of rows. If you have a query that you are expecting to execute once, but it is executed many times, or you were expecting it to fetch a few records and see it grabbing hundreds, it’s a place to investigate further.
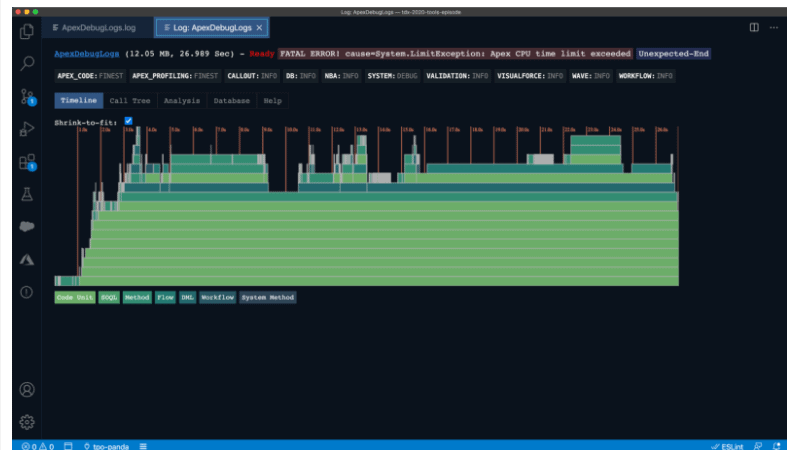
 Timelines: Probably the most exciting feature, the Timeline view lets you see a call tree as a timeline. You can see what calls are nested and get an idea of the areas of code taking the longest to complete. This gives you quick visual clues to zero in on potential trouble areas. You can also hover over the timeline to get greater detail. This can be a great timesaver when trying to figure out an issue.
What’s next for the Apex Log Analyzer?
While it was designed to meet our own developers’ needs – now that we’ve released it to the wider community we can see it from a different perspective and incorporate the feature requests and input we are getting from there. We hope to broaden the capabilities to be a truly universal tool.
Where else can we learn more about it?
We will be joining a Trailhead Live session with Nate Totten on January 28th to discuss the tool and Salesforce published a great blog last month. You can also find and install the extension from the Visual Studio Code Marketplace.
I love seeing this tool take off and helping developers around the world.